Marcellus Shale Natural Gas Drilling in Northern West Virginia
 Figure 5
This growth in West Virginia's economic activity may have been driven in part by developing Marcellus Shale natural gas resources.Since 2006, natural gas drillers have completed nearly 1,600 Marcellus Shale wells in West Virginia, with another 1,273 wells still in some stage of development. The extraction of this gas is accomplished through hydraulic fracturing. The development of these natural gas extraction wells in WV is driven by the country’s need for cleaner burning energy and this relatively new extraction technology. Hydraulic Fracturing (fracking) is a controversial method due to the large amounts of freshwater needed and its use of proprietary drilling fluids for the process, its effect on water resources and the possibility for contaminants to be released into the environment. (USGS)
The leading counties of Marcellus Shale gas production in West Virginia are predominantly located in the northern part of the state (See Figure 5).
The leading counties of Marcellus Shale gas production in West Virginia are predominantly located in the northern part of the state (See Figure 5).
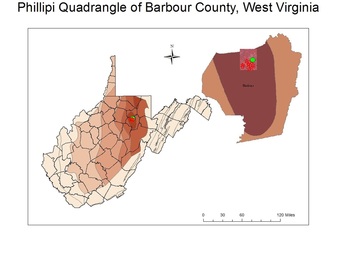 Figure 6
To demonstrate the spatial footprint created from these gas wells, a small study area was chosen in the northeastern Phillipi quadrangle of Barbour County. (see Figure 6) Projections of future Marcellus gas development impacts depend on robust spatial measurements for existing Marcellus well pads and infrastructure. Spatial data layers on West Virginia oil and gas development permits, road, physical features and government boundaries were compiled for this assessment. Spatial foot prints were identified for 30 of the 57 Marcellus well sites across the study area by comparing both color aerial photos and infrared aerial images of West Virgina Department of Environmental Protection (DEP) Office of Oil & Gas Marcellus well permit locations taken before and after development. For each well site, the area for the well pad, new or expanded roads, gathering pipelines, and water impoundments were digitized and measured using ESRI ArcMap software.
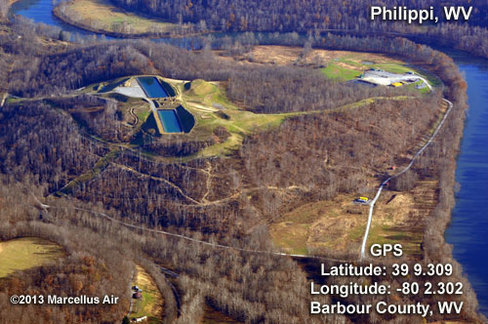 Figure 7A
The largest area of impact in the Phillipi Quadrangle is shown in Figures 7A and 7B. To assess the potential interior forest habitat impact, a 100-meter buffer was created into forest patches from new edges created by cleared sites due to well pad and associated infrastructure development and new edges created by road cuts. The overlap of these areas was excluded from the analysis.
Forest fragmentation refers not only to the area of forest cleared, but also to the pattern of this clearance, the resulting forest's spatial properties. The forest loss/landcover change is somewhat larger than expected because generally the well pad contributes to the greatest amount of forest/landcover change. In this study a substantial amount of impact is due to the edge effect. The study here does not include riparian or aquatic impact and would need to be investigated further for a more accurate representation of habitat impact.
Click on the following link for a summary table of the impact assessment in this area.
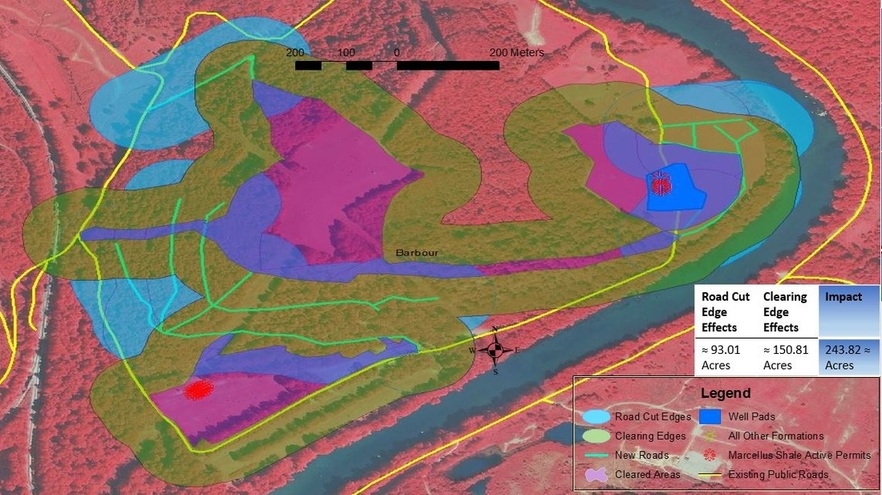
Figure 7. Largest area of impact in the Phillipi quadrangle.
New habitat edges created by well pad, new road lines and associated infrastructure development. (2007 CIR Image)
